Thursday, December 6, 2018

Stage 3

Build:
 So with my build I've tried  a few things.  I've tried modifying the make files to adjust the optimization levels ( default O3) to O2 and as you might expect, that killed performance. I wanted to just try to see what affect it would have had on the program.
Alternatively  I tried to modify the hot function which was a switch case. It worked just fine. With both the variants in the code that I tired.

I also tried to hunt down the abundant amount of syscalls but it seemed to be a futal attempt to actually change them. They were all needed  for each call sadly. (Who would have thought facebook to make super optimized code)

size_t ZSTD_compressBlock_doubleFast(
        ZSTD_matchState_t* ms, seqStore_t* seqStore, U32 rep[ZSTD_REP_NUM],
        void const* src, size_t srcSize)
{
    const U32 mls = ms->cParams.searchLength;
//Remove  && mls < 8
return (mls > 3 && mls < 8) ? ZSTD_compressBlock_doubleFast_generic(ms, seqStore, rep, src, srcSize, mls, ZSTD_noDict) : ZSTD_compressBlock_doubleFast_generic(ms, seqStore, rep, src, srcSize, 3, ZSTD_noDict);
    /*switch(mls)
    {
    default:  // includes case 3
    case 4 :
        return ZSTD_compressBlock_doubleFast_generic(ms, seqStore, rep, src, srcSize, 4, ZSTD_noDict);
    case 5 :
        return ZSTD_compressBlock_doubleFast_generic(ms, seqStore, rep, src, srcSize, 5, ZSTD_noDict);
    case 6 :
        return ZSTD_compressBlock_doubleFast_generic(ms, seqStore, rep, src, srcSize, 6, ZSTD_noDict);
    case 7 :
        return ZSTD_compressBlock_doubleFast_generic(ms, seqStore, rep, src, srcSize, 7, ZSTD_noDict);
case 8 :

    }*/
}


The above is the code I focused my efforts on. That was the whole block of code that took up the entire 56%+ run time of the program while doing it's compressions.

return (mls > 3 && mls < 8) ? ZSTD_compressBlock_doubleFast_generic(ms, seqStore, rep, src, srcSize, mls, ZSTD_noDict) : ZSTD_compressBlock_doubleFast_generic(ms, seqStore, rep, src, srcSize, 3, ZSTD_noDict);

This line here was supposed to help minimize the operations needed cutting out the whole switch statement as a whole.


return (mls > 3)  

Additionally I tried with the above variant of the  clause to yet again cute back on operations.


All of these changes built fine and passed smoke tests and also gave me all the proper results with out a problem. 


Testing:
 As for testing goes with the project. I've been lucky in the sense of nothing has broken when I build and tested anything. Every modification I tried build successfully and passed the smoke tests that came with the package.

With the smoke tests cleared and the build successful I then had to run tests on my actual test data! So I build a script to run the application 50 times.  and I ran this a few several times in each iteration . I was quite sad to see the results.

Turns out that even though what looks via code to cut back the operations needed for the function to work. after running several hundred tests.  It seemed that each iteration had 0 affect. This might be due to the O3 settings just absolutely going over board and even optimizing the switch statement.
With in reasonable variance, the resumes of the system stayed between 0.08ms and 0.05ms (This was the test data whit 150 photos). This result was consistent across all modifications and the original build.

As far as how useful this might be. I think it is a is somewhat useful to know. Facebook did a bang up job in this software. It's super fast like the advertise and honestly it's well build.  It really shows that there isn't a whole lot you can really do to the code to push it better. I'm guessing someone who might be better and some software engineer might be able to tell me otherwise but to the best of my ability I cannot push the software to be more optimized.

This is all very repeatable. Super easy to repeat the results that I got from my testings.

Analysis:
Benchmarking, it's been a lot of running a script to stuff data into the program and run it over and over and over. I've yielded all the same results from everything that was done. Nothing seemed to improve anything and just kept giving me the same result (minus o2). My guess is maybe that the data I used could have actually only ever triggered the default method. This is just an assumption and I wouldn't know how to force trigger the higher values for the method.

I think the methods that I used to not only attempt to optimize the software and test the software was reasonable. It was very consistent. using the same data all the way through. and testing the specific section that lit up like a Christmas tree. Things were consistent and specific. I think it was a very safe way to go about working and testing.

As  far as pushing this upstream I wouldn't bother due to the lack of improvement. There isn't any reason to add non-optimized code upstream.

Wednesday, November 21, 2018

Project Plan Stage 2

This is the stage 2 documentation for project.

Build:

I was able to build the Zstandard software on the yaggi server with out any issues. I installed it locally to my directory just to play it safe as far as messing up the system or other files goes.
I tested several times with the software to compress my own files and it worked just fine.

The software did pass it's smoke test! It came with a make check file to run and it yield clean positive results.

As well the target system is the yaggi server which is an  x86_64 architecture server.

Test Setup:

As far as my test data goes I have collected a few screen shots that I had sitting on my phone as the test data. A selection of 15 photos. I plan to multiply that quantity by 10 giving me 150 photos to process which should and has shown a reasonable time to compress.  I'm simply just copying the same 15 files 10 times over for the larger quantity of test data. This way I can know it is at least consistent.

Benchmarks:

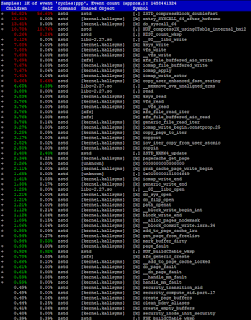
For the benchmarks I was able to  clock about 0.45 seconds to compress 150 photos (which is super quick - good job Facebook). I ran theses tests well over 10 times both with the small 15 sample size and the 150 sample size. It simple just multiplied the time it took by 10. Which is what I was expecting. That showed to me that there was nothing fancy happening with the larger amount of data. Just a static system for that data set multiplied. So this was very repeatable and you should yield the same results within reasonable times just due to the nature of server loads. Now out side of the times, I ran perf and the and found out that with the 15 photo sample the compression took less time than the overhead of the system setting things up. When I switched to the 150 sample the opposite happened. Which makes sense simply due to it taking 10 times longer to compress with the data being 10 times larger.  The function was actually a constructor. As see the "compressBlock_doublefast"  That is the main compression system doing the heavy lifting for the program. The rest of the red in the photo below you see  is mostly just system set up! This was super consistent across multiple tests,  even after warming up the cache.


Monday, November 19, 2018

Project Update

Sofar I was having the issue of the server not having the hardware needed to run perf. That was recently resolved last night. So I finally went ahead and ran some of the perf tests on the Zstandard software running it against a pack of varied sized jpeg photos. a set of 15, and then set of 150. ( I made 10 copied of each photo) I wanted to see consistency.  I also ran a few time tests on it and I got it with in a few thousandth of a second as far as how close to similar results go. The time just scaled by a factor when I multiplied the quantity of photos by 10. It simply took 10x longer. Which made sense. It was the same data but 10 times more.  Not the perf. I found out that the time to compress 15 photos was so small that the system overhead setting up the program took 5 times longer than the compression! How ever when I bumped the number of photos up to 150, that obviously dropped. So it was roughly  50% to compression and about 15-30% for system overhead.


This is the time test with 15 photos


This is the time test with 150 photos


This is the perf report compressing 150 photos! You can see it spends a lot of time on the one function. Which is actually just a constructor for an object.  The file running it has a lot of checking going on though. different file sizes, finding files, checking end of streams and such.


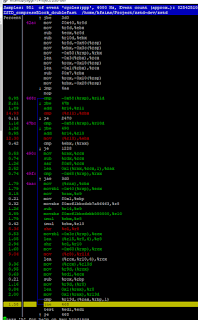
And lastly this is the assembler behind that main hot function. This is what the perf yields when you go deeper into the graph to look at what is happening. You an see that a  cmp in the assembler is being called a lot.

As of now I still do not have 100% of what I want to do with the project plan, but It should all be written up tomorrow night.

Saturday, November 10, 2018

Lab 5

In this  lab we ran through a few algorithms for volume adjustment.
We used a sample size of 100 million for the tests.

In our first test we ran the multiplied the samples by  0.5

In the second test we precalculated the samples before modifying the volume.

Lastly in the third test we multiplied the samples with an int and then bit shifted the samples to the appropriate values.

For the results:

Test 1: This seemed to have run at a middle speed being processor heavy with calculations
Test 2: This test ran the slowest as it took more cache and memory to process the large amount of samples
Test 3: Lastly this test ran the fastest. It was processor heavy but bit shifting seemed to save it some time.

Thursday, November 8, 2018

Project Plan

The Package?
I'll be looking into the ZStandard compressor. It is supposed to be a higher speed compression software.  I have yet to be able to get a proper perf command to run on it so I'll be looking more into that as soon as I can. But the compression seems like It should be able to have some sort of modification done to either improve size or speed so that is what I am aiming for:

Testing/Data?

 I plan to use a variety of  photos and text files to and compress them all at the same time and separately. Use them as my bench marks to see how it can handle the different types of data.  This should allow for a better in depth look at which parts are used in the compression


Optimizing?

I'd first like to try compiler options to see if there is any obvious improvements or breaking of the program.  Things like setting to O3, enable vectorizing.. Additionally if the compiler settings do nothing or worsen it I will dig into the compression or decompression where hot spots show up to see what can be done. Again I have yet to be able to check due to server issues but that's the goal.

Wednesday, November 7, 2018

Struggles of finding a package!

So I spend a good few hours the other night trying to find a package in a panic to not only find one not taken by other students, one that was in c/cpp,  and then trying to find something inside of the package that might yield some results of promise for the project. I personally couldn't really find what I thought that I might need to be looking for and was just confused and lost. So I ended the night and planned to try again the next night. I looked at PeaZip, and Zstandard. PeaZip was after a while of trying to get the files I found it that It was pearl. Which I probably could have guessed from the "Pea" part of the name.  Zstandard was in c /cpp which was great but I was starting to get tired and stressed to and at that point had minimal to no idea what I was trying to accomplish. So i'll be running test on Zstandard tonight to test it and find out what I might be able to do to it.

Sunday, October 28, 2018

Lab 4

The goal of this lab was to  see first hand the differences between  aarch64 and x86_64 assembly code

in the example we had
Both started at the top with
.text
.global _

defining values were the same as well
with things like the following
start = 0
max = 0 

How ever function calls are different (mostly)

_Start:  << was a common factor

how ever
loop: << x86
_loop: <<aarch

one needed the _ where the other didn't

In the x86 we have more
 things like movq << the q specifically instead of mov(aarch)
it uses %num , %othernum
where as in aarch it use more simple with just and x before for registers
aarch has a cleaner looking code style with less special symbols needed for the values and items being passed or moved.